Description:
Some years ago I used rsyslog with LogAnalyzer for monitoring of system logs. It was not brilliant solution, but it worked and it was best than parse logs by hands. Then appeared Elasticsearch which changed rules of game.
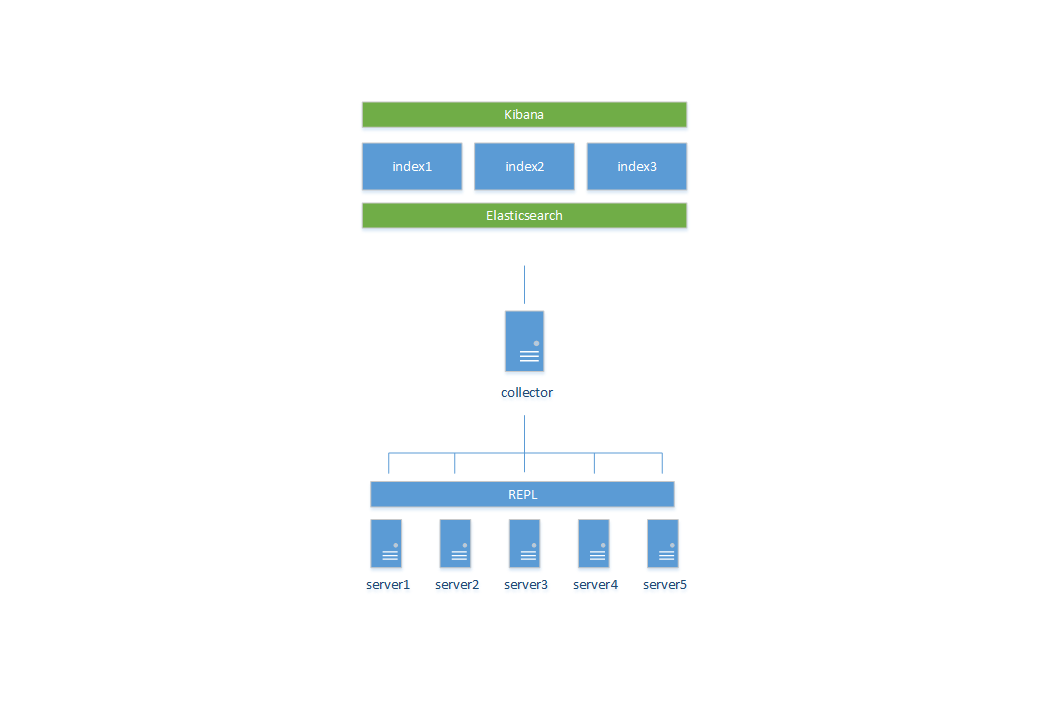
All data from servers flows through rsyslog, which transmits data in JSON format to the Elasticsearch. My Elasticsearch not running all time so I need mechanism, which can collect data from servers and after appearing of Elasticsearch should transmit all collected data him. This mechanism provides rsyslog, which may collect data up to a certain limit and constantly try to transfer data. All nodes use REPL protocol for sending data.
Upgrade is: Elasticsearch 1.4 -> 2.0, Kibana 3 -> 4. In new version of Elasticsearch exist many changes, but main interest is new version of Kibana.
Main diagram:
System dashboard consist:
- Sum of events for all nodes (who generate the most events).
- HTTP requests and type of operating systems.
- Quantity of running virtual machines (to persuade themselves to upgrade the server).

Security dashboard consist:

